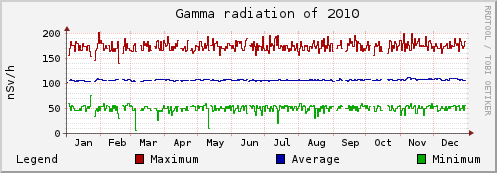
I wrote a small program to read the geiger ticks and store those with a high
resolution timestamp of each event.
Here is the core of the radread.c program :
1 2 3 4 5 6 7 8 9 10 11 12 13 14 15 16 17 18 | while(1) { retval=read(fd, &a, 1); /* block until +5V pulse is read */ if (retval == 1) { gettimeofday(&tval, &tzone); ptm=gmtime((const time_t *)&tval.tv_sec); printf("%4d-%0.2d-%0.2d %0.2d:%0.2d %0.2d.%0.6ld\n", ptm->tm_year + 1900, ptm->tm_mon + 1, ptm->tm_mday, ptm->tm_hour, ptm->tm_min, ptm->tm_sec, tval.tv_usec); } else { if (retval == 0) { fprintf(stderr, "end-of-file\n"); } else { int *perr = __error(); fprintf(stderr, "Error %d\n", *perr); } } } |
This generates about 250 MiB of data per year.
A periodic generated HTML page serve the graphs to a web server.
The serial port sometimes gives up over my abuse, those are the blank
periods in the graphs.
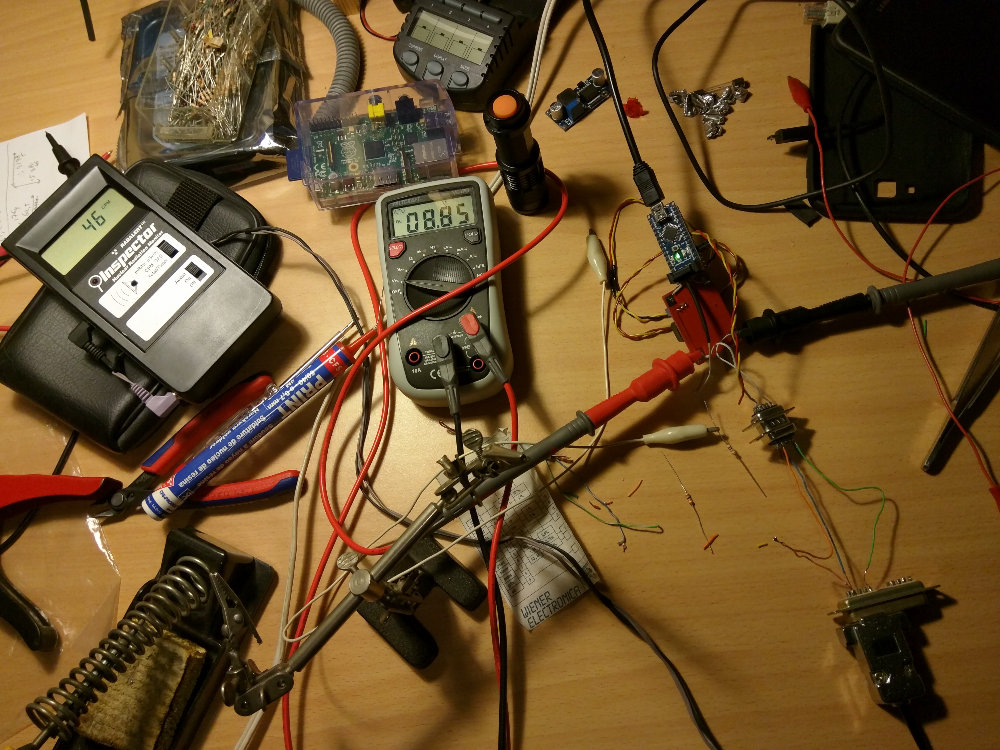
Here's a photo of this proof of concept work :

The Geiger counter is on the left, the Arduino is the small blue electronics board with the green lit led, the LM2577S voltage step up booster is upside down, just below the Arduino. The voltmeter shows the voltage supplied to the Geiger counter. The Raspberry Pi above the voltmeter is unused here.
Here's the Arduino code^h^h^h^hSketch :
1 2 3 4 5 6 7 8 9 10 11 12 13 14 15 16 17 18 19 20 21 22 23 24 25 26 | int led = 13; volatile int state = LOW; void setup() { Serial.begin(9600); pinMode(led, OUTPUT); attachInterrupt(0, geiger, RISING); } void loop() { if (state == HIGH) { state = LOW; digitalWrite(led, HIGH); Serial.println(1); delay(10); digitalWrite(led, LOW); } delay(1); } void geiger() { state = HIGH; } |
I'll add high resolution timestamps with a support program that reads the serial-over-USB datastream.
-- Hans