Dewpoint is calculated from their measurements as follows:
my $gamma = ( (17.27 * $temperature) / (237.7 + $temperature) ) + log (($humidity + 0.001)/ 100);
my $dewpoint = sprintf("%0.2f", (237.7 * $gamma) / (17.27 - $gamma));
The 0.001 offset to the humidity in the formula is to prevent the log from exploding when the sensor gives a false reading of 0 humidity :)
This code gets a reading from a sensor given a pin on a RPI. Example output is :
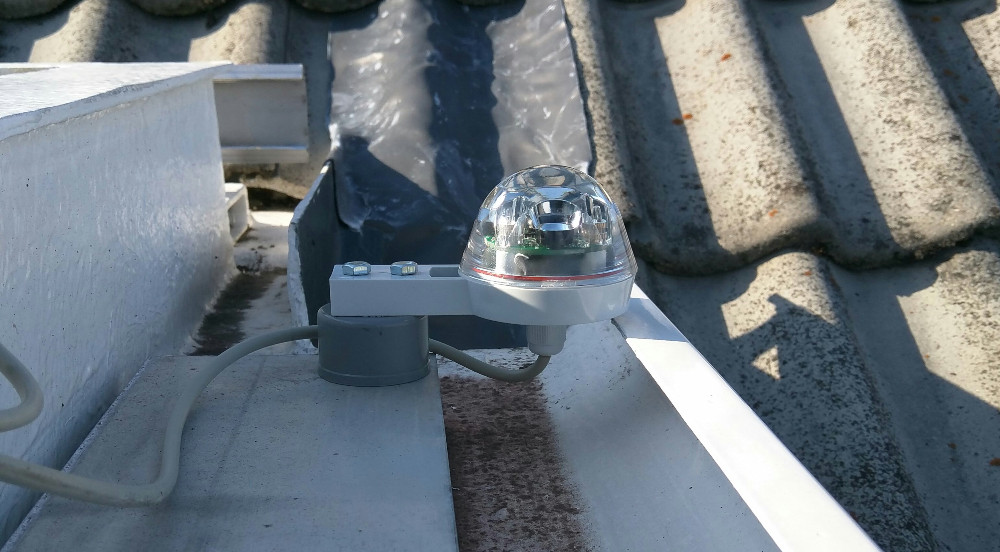
pin 16 Humidity = 42.70 % Temperature = 17.40 *CI use a few of these sensors; one in the observatory, one outside and one in the all sky camera enclosure.
Reading them out with this code which applies a correcting offset to both the temperature and the humidity and prepares the output for rrdtool. The results are stored in /dev/shm/ which does not stress the RPI SD card. They're later picked up by the script and sent to the database server.
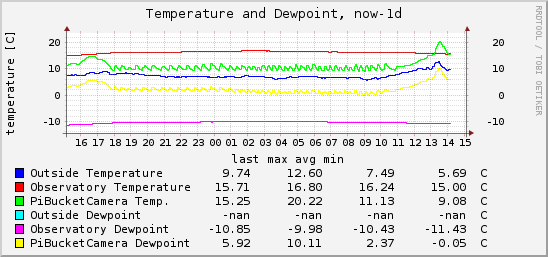
Example results :
I wrote this code which continuously polls the status of the relay from a RPI. It stores the number of counted drops of the last 60 seconds in /dev/shm/value_raindrop_sum, and the number of drops counted for the last 60 minutes in /dev/shm/value_raindrop_history.
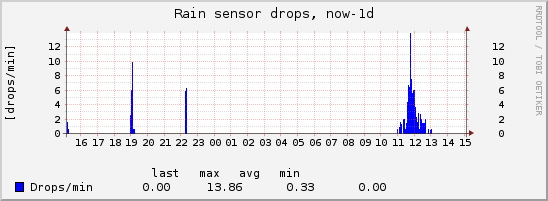
Example output of a dry hour :
rpi:/dev/shm/ cat value_raindrop_sum
0
rpi:/dev/shm/ cat value_raindrop_history
0 0 0 0 0 0 0 0 0 0 0 0 0 0 0 0 0 0 0 0 0 0 0 0 0 0 0 0 0 0 0 0 0 0 0 0 0 0 0 0 0 0 0 0 0 0 0 0 0 0 0 0 0 0 0 0 0 0 0 0
On heavy rain I've seen these numbers rise to about 250.
Example result of a day that had some rain :
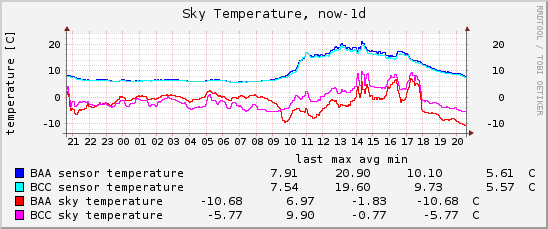
Here's the MLX90614-BAA and MLX90614-BCC sensors when they were still new :
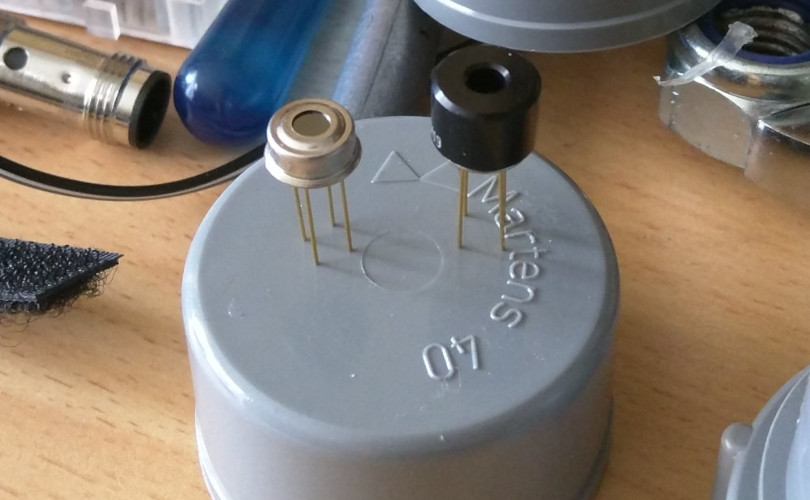

And here's how they look like after being outside for over 8 years :

These two sensors are exposed naked to the sky. The -BAA model sensing window can be cleaned, the BCC model sensing window is a few mm deep in a narrow cavity. I cannot reach it and thus cannot clean it. This limits the use of the BCC sensor until I find a shield that is transparent to far-infrared.
These sensors are to be read with the i2c protocol. Each device has an address on a bus where multiple devices can be attached to. Neat. I wrote some code to read out the MLX sensors on a RPI and store the results in /dev/shm/ files.
Example output of the BAA sensor :
rpi:/dev/shm/ cat value_skytemperature-BAA_object
-10.32
rpi:/dev/shm/ cat value_skytemperature-BAA_sensor
8.02
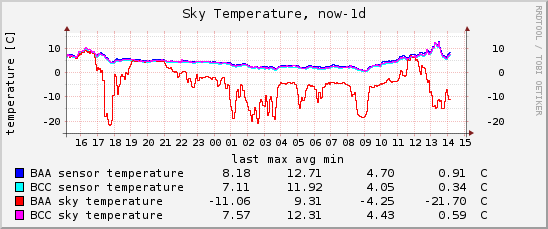
Example graphs :
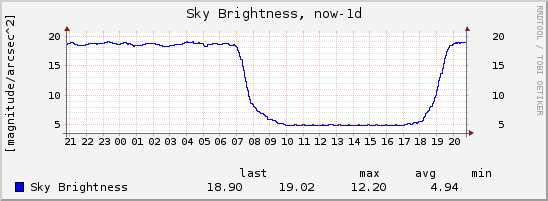
The sky brightness can then be calculated with 22.0 - 2.5*log10(hz) and reports in mag/arcsec^2.
Calibration.
My first reading comparison in 2015 was a measurement of 18.77 against what my sqm-l produced: 18.75 mag/arcsec^2. Very good.
After a few years of continuous use and outdoor exposure however I found I needed to add an offset to these readings.
I now use :
rpi:~/ cat sqm_offset.conf
# sqm offset
offset = -2.975
The code that I wrote maintains its results in /dev/shm/value_sqm_sqm and is called from here which sends all /dev/shm results on to the database server.
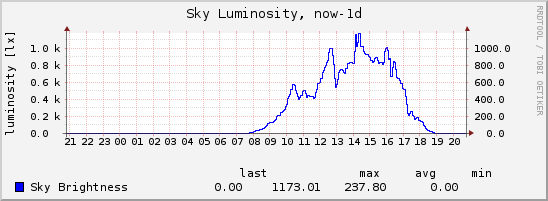
For daylight readings the AMS TSL237 sensor quickly saturates. The ROHM BH1750FVI ambient light sensor takes over at these times. It is an i2c device, so is read together with the MLX sensors here. Its results are given in lx.
Example graphs :
/dev/shm/rrdupdate* and sends that to a listener service at the database server.
Example output :
rpi:/dev/shm/ cat rrdupdate_luminosity
update luminosity.rrd -t luminosity N:0.00

rpi:/dev/shm/ cat rrdupdate_skytemperature-BAA
update skytemperature-BAA.rrd -t BAA_sensor:BAA_sky N:6.60:-10.64

rpi:/dev/shm/ cat rrdupdate_tempandhum-observatory
update tempandhum-observatory.rrd -t temperature:humidity:dewpoint N:16.60:58.30:8.38
The database script uses 1 row per minute. It gathers all sensor data in 1 row and when a minute has passed when a new sensor reading arrives it creates a new row.
The database schema for the sensors is :
mysql   SHOW CREATE TABLE sensors\G
*************************** 1. row ***************************
       Table: sensors
Create Table: CREATE TABLE `sensors` (
  `sensors_id` int(11) NOT NULL AUTO_INCREMENT,
  `create_time` datetime NOT NULL,
  `observatory_temperature1` float(5,2) DEFAULT NULL,
  `observatory_humidity1` float(5,2) DEFAULT NULL,
  `observatory_dewpoint1` float(5,2) DEFAULT NULL,
  `outside_temperature1` float(5,2) DEFAULT NULL,
  `outside_humidity1` float(5,2) DEFAULT NULL,
  `outside_dewpoint1` float(5,2) DEFAULT NULL,
  `BAA1_temperature_sky` float(5,2) DEFAULT NULL,
  `BAA1_temperature_sensor` float(5,2) DEFAULT NULL,
  `BCC1_temperature_sky` float(5,2) DEFAULT NULL,
  `BCC1_temperature_sensor` float(5,2) DEFAULT NULL,
  `sqm1_luminosity` float(7,2) DEFAULT NULL,
  `sqm1_frequency` int(11) DEFAULT NULL,
  `sqm1_sqm` float(4,2) DEFAULT NULL,
  `rainsensor1_pulses` int(11) DEFAULT NULL,
  `rainsensor1_drops` int(11) DEFAULT NULL,
  `allskycam1_temperature1` float(5,2) DEFAULT NULL,
  `allskycam1_humidity1` float(5,2) DEFAULT NULL,
  `allskycam1_dewpoint1` float(5,2) DEFAULT NULL,
  `allskycam1_stars` int(11) DEFAULT NULL,
  `ups1_status` tinyint(1) DEFAULT NULL,
  `ups1_linev` float(5,2) DEFAULT NULL,
  `ups1_loadpct` float(5,2) DEFAULT NULL,
  `ups1_bcharge` float(5,2) DEFAULT NULL,
  `ups1_timeleft` float(5,2) DEFAULT NULL,
  `ups1_itemp` float(5,2) DEFAULT NULL,
  `ups1_battv` float(5,2) DEFAULT NULL,
  `ups1_linefreq` float(5,2) DEFAULT NULL,
  PRIMARY KEY (`sensors_id`),
  KEY `create_time` (`create_time`)
) ENGINE=InnoDB AUTO_INCREMENT=741495 DEFAULT CHARSET=latin1
1 row in set (0.00 sec)
The last complete minute as of this writing as an example:
mysql   SELECT * FROM sensors ORDER BY sensors_id DESC LIMIT 2\G
*************************** 1. row ***************************
              sensors_id: 741497
             create_time: 2020-10-13 19:58:32
observatory_temperature1: 16.40
   observatory_humidity1: 58.20
   observatory_dewpoint1: 8.16
    outside_temperature1: NULL
       outside_humidity1: NULL
       outside_dewpoint1: NULL
    BAA1_temperature_sky: 2.08
 BAA1_temperature_sensor: 8.36
    BCC1_temperature_sky: 4.36
 BCC1_temperature_sensor: 8.00
         sqm1_luminosity: 0.00
          sqm1_frequency: 6
                sqm1_sqm: 17.12
      rainsensor1_pulses: 0
       rainsensor1_drops: 0
 allskycam1_temperature1: 11.00
    allskycam1_humidity1: 56.00
    allskycam1_dewpoint1: 2.56
        allskycam1_stars: 0
             ups1_status: 1
              ups1_linev: 230.40
            ups1_loadpct: 0.00
            ups1_bcharge: 100.00
           ups1_timeleft: 270.00
              ups1_itemp: 30.60
              ups1_battv: 27.40
           ups1_linefreq: 50.00
rrdtool create tempandhum-observatory.rrd -s 60
    DS:temperature:GAUGE:300:-30:50
    DS:humidity:GAUGE:300:0:100
    DS:dewpoint:GAUGE:300:-30:50
    RRA:AVERAGE:0.5:1:1500
    RRA:AVERAGE:0.5:10:1100
    RRA:AVERAGE:0.5:60:800
    RRA:AVERAGE:0.5:360:1500
#
 # 1d at 60s resolution
 # 1w at 10m resolution
 # 1m at 1h resolution
 # 1y at 6h resolution

rrdtool create rainsensor.rrd -s 60
    DS:pulses:GAUGE:300:0:500
    DS:drops:GAUGE:300:0:2000
    RRA:MAX:0.5:1:1500
    RRA:MAX:0.5:10:1100
    RRA:MAX:0.5:60:800
    RRA:MAX:0.5:360:1500

rrdtool create skytemperature-BAA.rrd -s 60
    DS:BAA_sensor:GAUGE:300:-40:125
    DS:BAA_sky:GAUGE:300:-70:380
    RRA:AVERAGE:0.5:1:1500
    RRA:AVERAGE:0.5:10:1100
    RRA:AVERAGE:0.5:60:800
    RRA:AVERAGE:0.5:360:1500

rrdtool create sqm.rrd -s 60
    DS:frequency:GAUGE:300:0:600000
    DS:sqm:GAUGE:300:0:30
    RRA:MAX:0.5:1:1500
    RRA:MAX:0.5:10:1100
    RRA:MAX:0.5:60:800
    RRA:MAX:0.5:360:1500
Updating is done in the listener.
It looks at sensor readings of the last completed minute, as well as those of the last hour to implement hysteresis to prevent flapping. The result is stored in another table in the database :
mysql   SHOW CREATE TABLE roof\G
*************************** 1. row ***************************
       Table: roof
Create Table: CREATE TABLE `roof` (
  `roof_id` int(11) NOT NULL AUTO_INCREMENT,
  `create_time` datetime NOT NULL,
  `sensors_id` int(11) DEFAULT NULL,
  `open_ok` tinyint(1) DEFAULT NULL,
  `reasons` varchar(128) DEFAULT NULL,
  PRIMARY KEY (`roof_id`)
) ENGINE=InnoDB AUTO_INCREMENT=560566 DEFAULT CHARSET=latin1
1 row in set (0.00 sec)
From which data mining can be done.
For instance here are the reasons why the observatory ever had to close while in robotic mode:
mysql   SELECT count(*), reason FROM events WHERE event = 'closing' GROUP BY reason;
+----------+-------------------------+
| count(*) | reason                  |
+----------+-------------------------+
|      138 | Not dark enough anymore |
|      178 | Too cloudy              |
|        3 | UPS on battery          |
+----------+-------------------------+
3 rows in set (0.01 sec)
Last page update : 2023-10-30T16:41Z -- Hans Lambermont